Diagnostics and Debugging
Diagnostics and debugging comprises of logging Functions and debugging Functions.
Logging Functions
The Eventing Service creates two different types of logs:
-
Eventing Logs
-
Application Logs
Eventing Logs
Eventing Logs, termed also as system logs, captures system errors for the Eventing Service. System errors get logged depending on the level and severity of the reported problem. For every node a separate system log file, eventing.log, gets created.
Explicit logging can be performed by means of the Couchbase CLI utility cbcollect_info tool.
Eventing logs are similar to other logs. For more information on log file locations, Log Rotation and Log File Listing, refer to clustersetup:ui-logs.adoc
The eventing.log file contains redactable user data, see clustersetup:logging.adoc#understanding_redaction.
Application Logs
In the Eventing Service framework, Application logs capture various Function related activities and errors. Function-related activities such as editing the handler code, modifying feed boundaries conditions, and debugging activities, get recorded in the Application logs.
| The cbcollect_info tool does not collect the Application log files. |
Configuring Application Logs
Unlike System logs, Application logs are user-configurable. You can access an Application log file using the command line interface. Couchbase Server creates different application log files (one for each Function) depending on the level and severity of the reported problem, as configured during the Function definition.
To configure an Application log, use the REST endpoint settings option.
Sample URL for configuring application logs
192.168.1.5:8091/_p/event/api/v1/functions/<Function_name>/settings
Sample Payload for configuring application logs
{
  "settings":
    {
  	"app_log_max_files": 10,
  	"app_log_max_size": 10485760
    }
}
The sample payload above illustrates that the system stores 10 application log files and each file records about 10 MB of data.
Application Log File Locations
Based on your platform, Couchbase Server stores Application log files in the following locations.
Platform |
Location |
Linux |
/opt/couchbase/var/lib/couchbase/data/@eventing |
Windows |
C:\Program Files\Couchbase\Server\var\lib\couchbase\data\@eventing (Assumes default installation location.) |
Mac OS X |
/Users/<user>/Library/Application Support/Couchbase/var/lib/ couchbase/data/@eventing |
Note: During Cluster setup, if you have chosen a custom path, then the path for Application logs is same as that of the selected Indexes Path. The @eventing folder in the selected Indexes Path stores the Application logs.
Application Log File Rotations
By default, the maximum size of an Application log file is 40MB, and the number of log files before rotation is 10. Couchbase Server stores 10 rotations (the current rotation plus nine compressed rotations).
For illustration, consider enrich_ip_nums as the name of the Function. A corresponding Application log file, enrich_ip_nums.log, gets created in the Couchbase cluster. Whenever the enrich_ip_nums.log reaches 10MB in size, assuming the maximum size of an Application log file is 10MB and the number of log files before rotation is 10, the system automatically generates the enrich_ip_nums.log.1 file, during its first iteration. The file enrich_ip_nums.log transfers all the log information to this new log file. For this illustration, since the number of log files is 10, the system stores 10 such files, the currently active log file along with 9 truncated files, at any given instance.
| Log redaction is applicable only for System logs and not for Application logs. |
Debugging Functions
At times, your Function handler code may contain syntax errors and logical errors.
The JavaScript engine flags any syntax error during the Function deployment step. However, logical errors are a little difficult to diagnose. If your Function handler code contains a logical error, then there will be no log messages, no error notifications, or any indications from where you can start the debug process. At these times the Visual Debugger, available out-of-the-box, is extremely useful.
The Eventing Service in Couchbase Server contains a native online real-time Javascript Debugger tool. This Visual Debugger tool integrates seamlessly with the Google Chrome Debugger engine. With the Debugger tool, you can set breakpoints in the JavaScript and step through it using a tool like Chrome.
| Important: Debugging is a convenience-feature intended to help during Function development: it is not designed for production environments. Debug mode should not be used in production environments, as it affects the in-order processing of the document mutations. Additionally, the debug sessions introduce timing related issues. |
Default Debug Port
Port 9140 is the default Eventing debug port. To change the default port settings, see Modifying the Debug Port.
Debugging Workflow
During a debug session, a single mutation received by the Function is considered and sent to the Debugger. This technique ensures that processing of the other data mutations in the cluster does not get blocked. The Worker in the Debugger pauses to trap the next event-instance, opens an ephemeral TCP port, and generates a Chrome dev-tools URL, with a session cookie that controls the debug worker. All other events are unaffected except the trapped event-instance.
Post event trapping, you can place breakpoints in the code and run the Function execution, one line at a time. This step-step execution helps to troubleshooting any logical errors in your Function handler code.
If the debugged event-instance completes its execution, then no further event-instance gets trapped for debugging. For some reason, if a debug session gets terminated during execution, then the mutation may be abruptly processed
Debugging a Function
-
To enable debugging, navigate to Couchbase Web Console > Eventing page, from the top banner, click Settings and check the Enable Debugger option.
-
From the Eventing page, click on the name of a deployed Function. The deployed Function expands to provide additional options. Click Edit JavaScript.
-
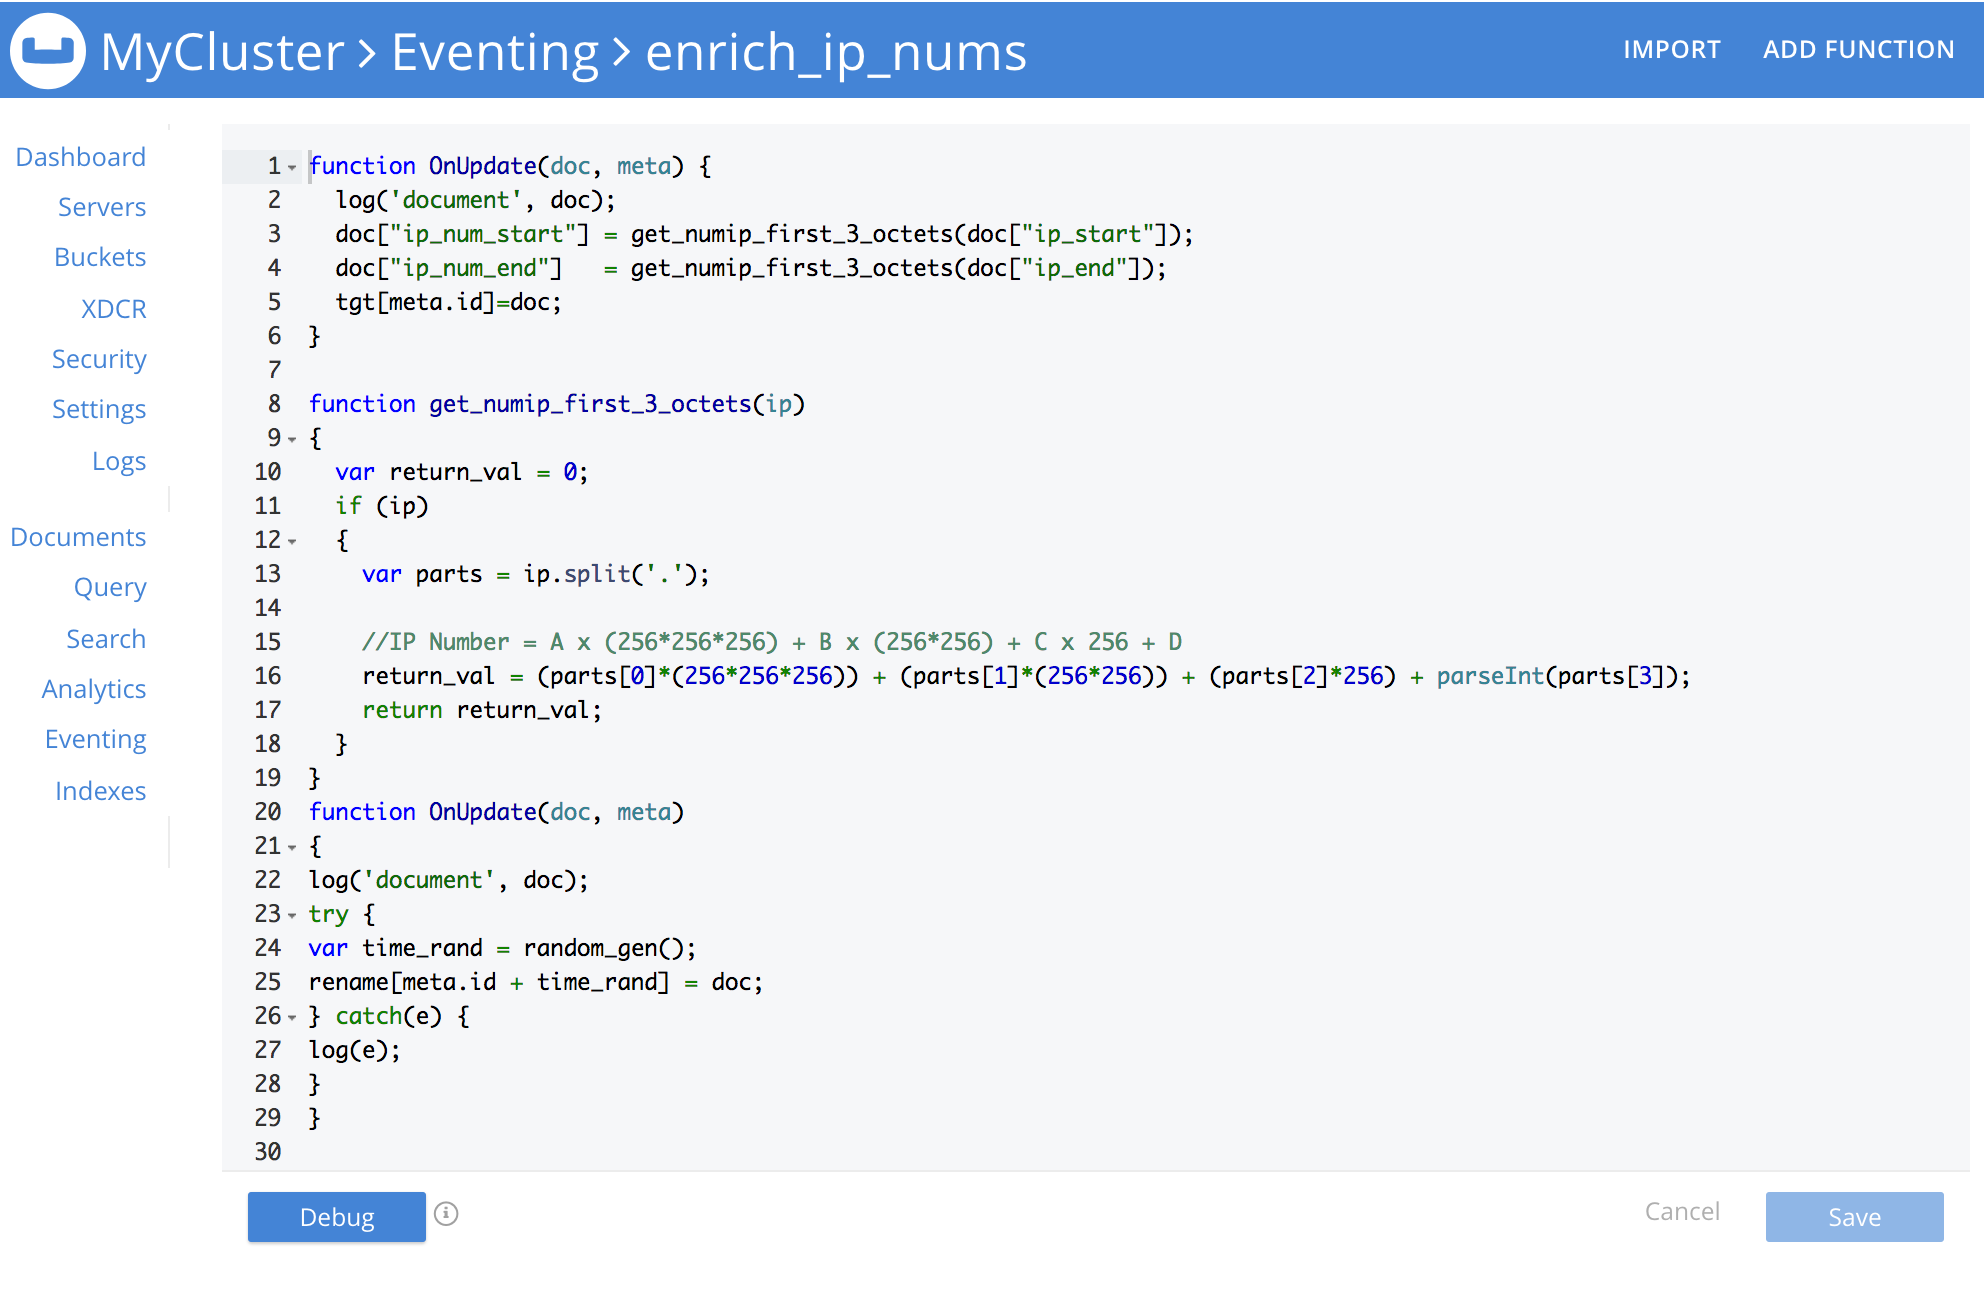
From the Edit Function page, click Debug. A debug session gets activated. As a result, the next event-instance gets trapped and is forwarded to the Debugger.
-
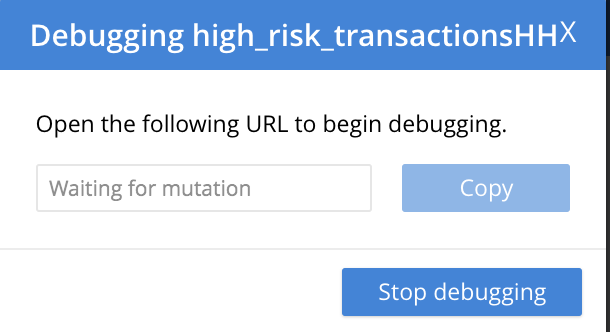
In the below screen, you can notice the message: "Waiting for mutation."
-
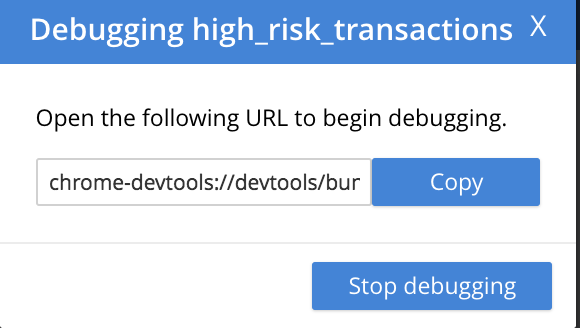
Upon a data mutation, the debug URL in the Debugging pop-up gets populated.
-
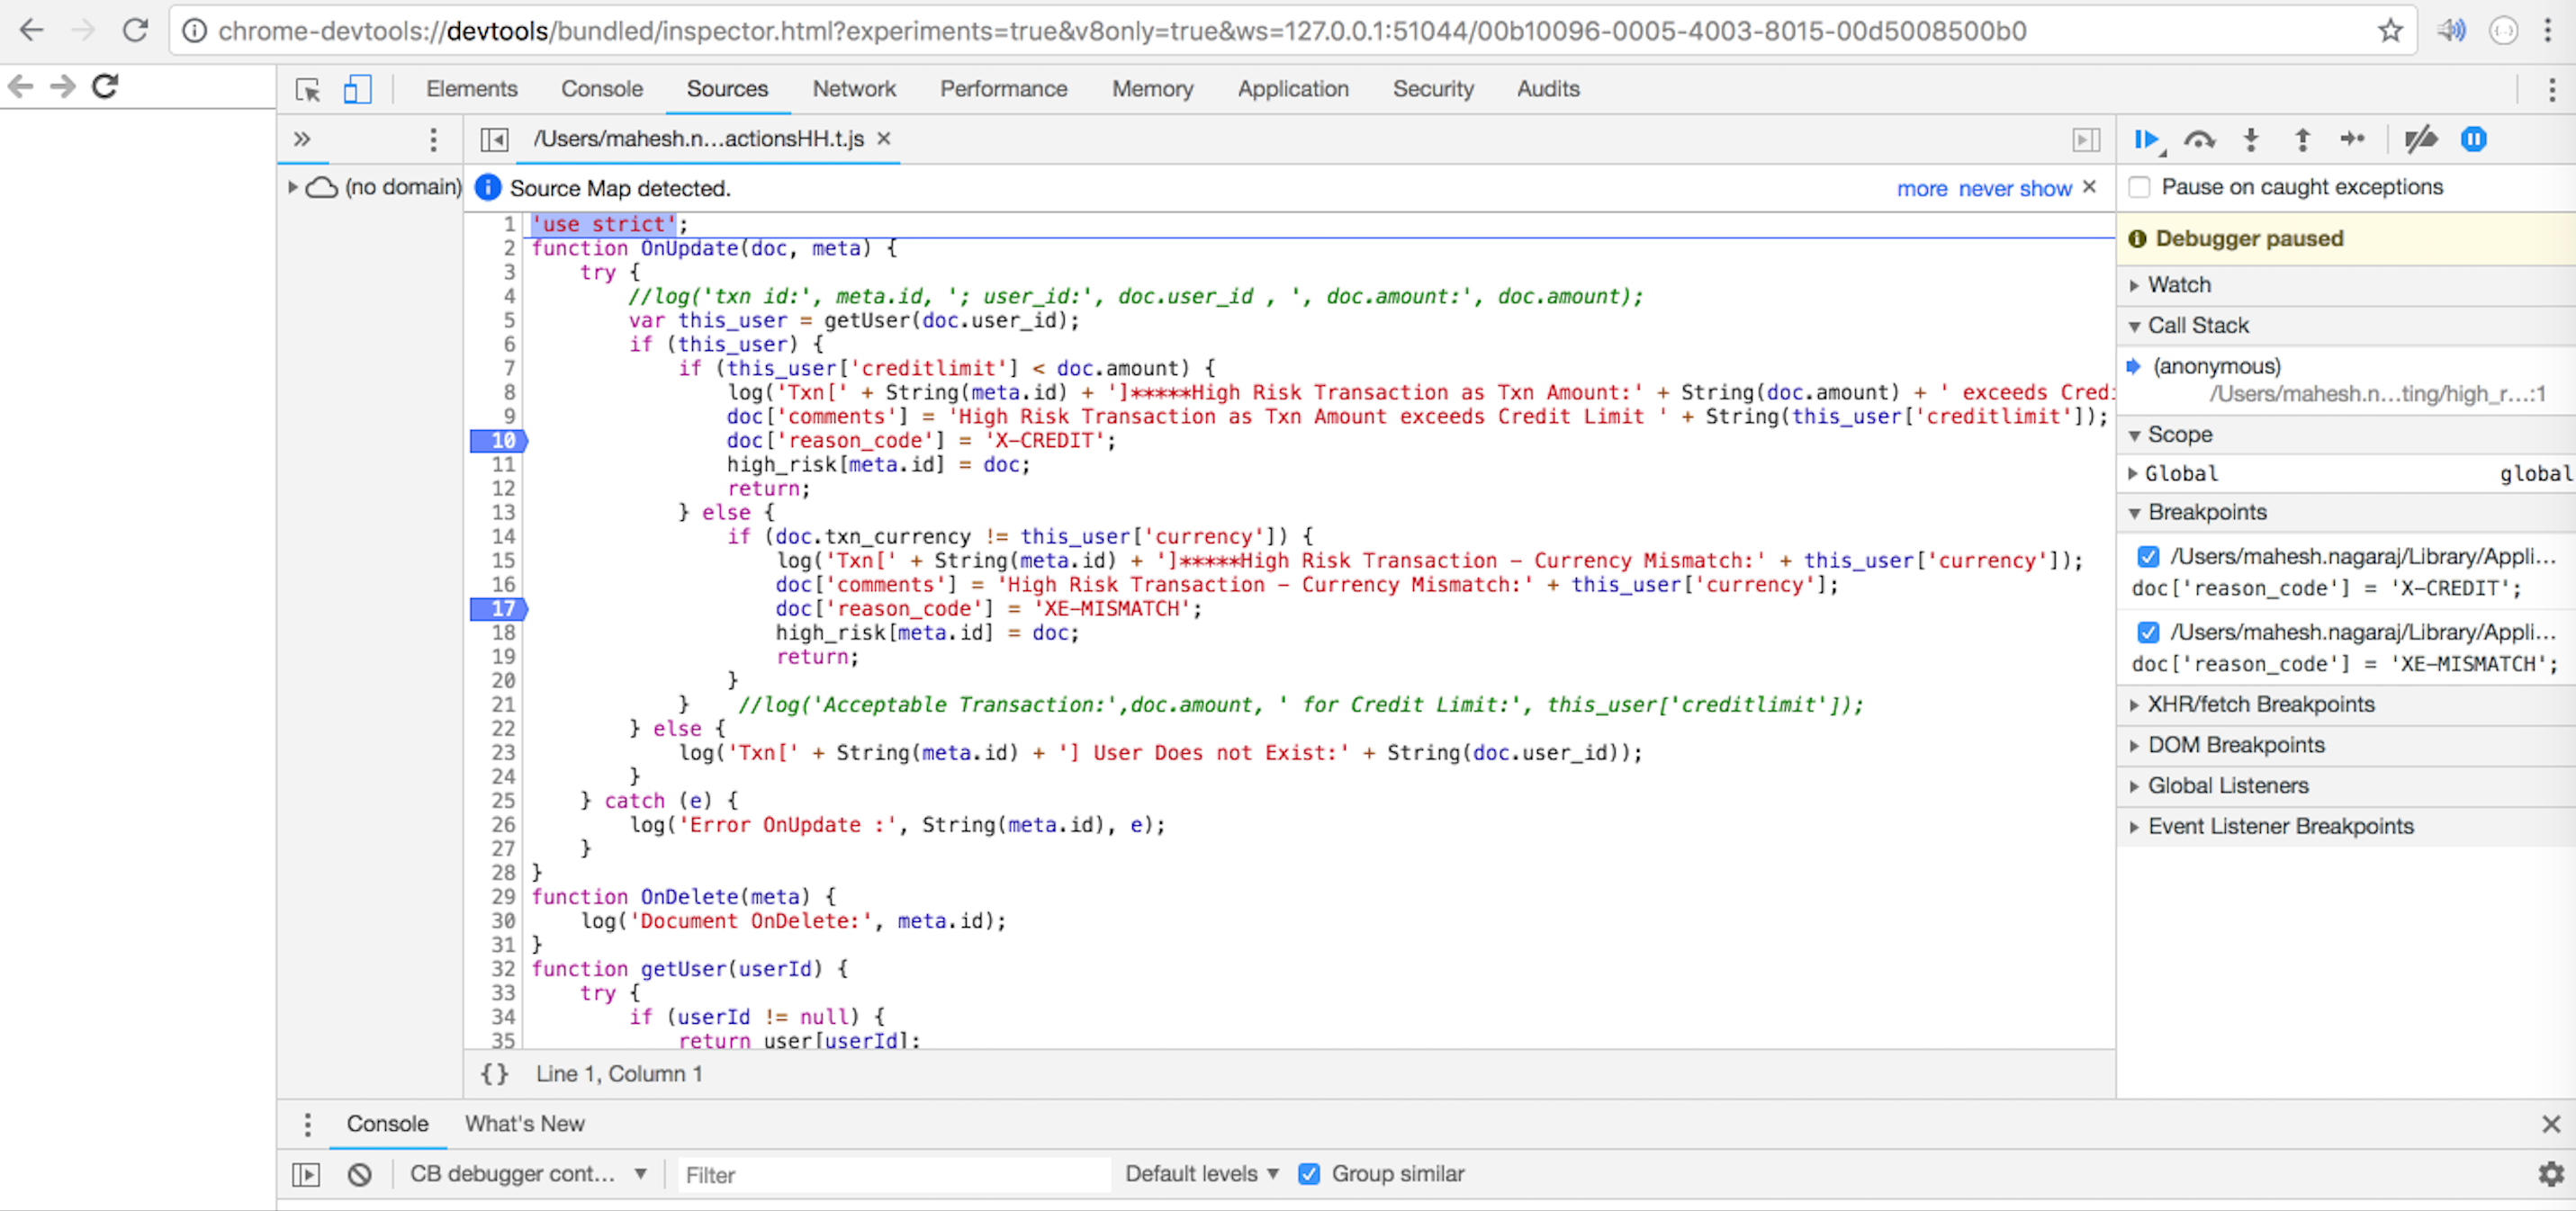
Copy and paste the URL from the Debugging pop-up to your Google Chrome browser.
-
From your Google Chrome browser, you can add breakpoints and run step-step diagnosis to debug and troubleshoot any logical errors in your Function handler code.
-
To terminate a debug session, from the Debugging pop-up, click Stop Debugging.
Transpiler and Source Map
A transpiler accepts source code provided as input from one high-level programming language and produces an equivalent code in another high-level programming language.
Couchbase Server uses a native transpiler. This transpiler converts the handler code to a code that the JavaScript engine can understand. If this transpiler was unavailable, then the JavaScript engine would have failed to compile any native N1QL queries.
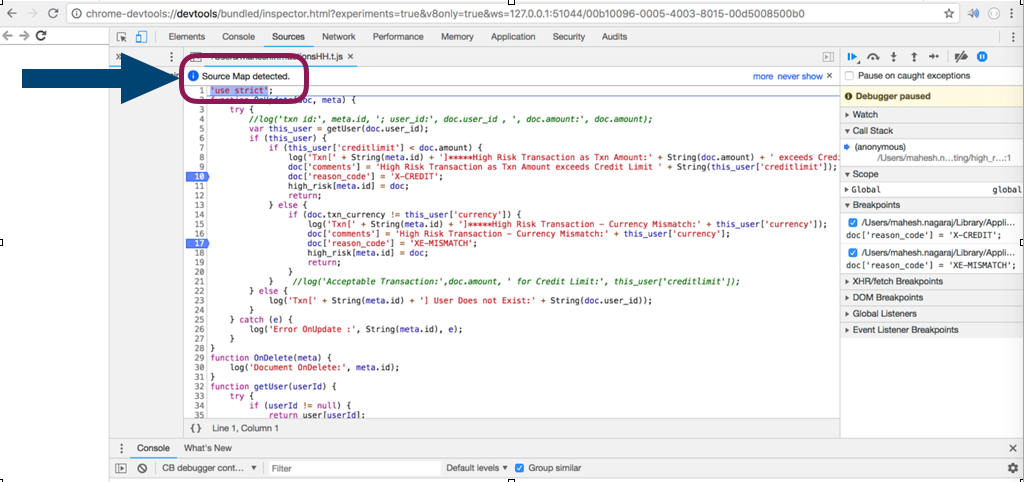
Source map, generated by our native transpiler, provides a mapping between the transpiled code and the original function handler code.
Debugging is easy as the debugger detects the source map and presents the code in the original format.
Upon source map detection, a text confirmation flag gets displayed in the debug window (highlighted below).
Modifying the Debug Port
By default, the ns_server configures the Eventing Debug on port 9140. Using the
static_config file you can modify the default Eventing Debug port.
To modify the debug port:
-
Stop Couchbase server.
-
Navigate to the /opt/couchbase/etc/couchbase/static_config file. This is the location where Couchbase Server picks up the configuration parameters.
-
Edit the static_config file to add the new eventing_debug_port and the new port-number information.
-
(Optional step) To remove any old configuration file, delete the /opt/couchbase/var/lib/couchbase/config/config.dat file.
-
Start Couchbase server.
| If no port numbers are not specified, default ports are used. To override some or all default ports, append the user-defined ports to the static_config file file. |