Monitor Statistics
From the Data Bucket menu, information and statistics about buckets and nodes is displayed for the entire Couchbase Server cluster. The information is aggregated from all the server nodes within the configured cluster for the selected bucket.
From the Couchbase Web Console > Buckets menu, click the Statistics link for each bucket. Each bucket page shows different graphs and statistics as explained below:
-
Bucket Selection - The Buckets selection list lets you select which of the buckets configured on your cluster is to be used as the basis for the graph display. The statistics shown are aggregated over the whole cluster for the selected bucket.
-
Server Selection - The All Server Nodes selection option enables you to limit the display to an individual server or entire cluster. The individual node selection displays information for the node. The all server nodes selection displays information for the entire cluster.
-
Interval Selection - The Interval selection at the top of the main graph changes interval display for all graphs displayed on the page. For example, selecting Minute shows information for the last minute, continuously updating.
As the selected interval increases, the amount of statistical data displayed will depend on how long your cluster has been running.
-
Statistic Selection - All of the graphs within the display update simultaneously. Clicking on any of the smaller graphs will promote that graph to be displayed as the main graph for the page.
Individual Bucket Monitoring
Bucket monitoring within the Couchbase Web Console has been updated to show additional detailed information. The following statistic groups are available for Couchbase bucket types.
-
Summary - The summary section provides a quick overview of the cluster activity.
-
Server Resources - This section provides information on the server resources across the cluster.
-
vBucket Resources - This section provides detailed information on the vBucket resources across the cluster, including the active, replica and pending operations.
-
Disk Queues - Disk queues show the activity on the backend disk storage used for persistence within a data bucket. The information displayed shows the active, replica and pending activity.
-
DCP Queues - This section provides show information about the DCP connections activity for the bucket.
-
View Stats - This section lets you monitor the statistics for each production view configured within the bucket or system.
-
Index Statistics - This section provides statistics about the GSI Indexes. Statistics are provided per each individual index.
-
Query Statistics - This section provides statistics about the N1QL query service. These statistics are aggregated numbers at the query service level across the cluster, and are not per bucket or per node.
-
XDCR Destination - The XDCR Destination section show you statistical information about the Cross Datacenter Replication (XDCR), if XDCR has been configured.
-
Top Keys - This section shows a list of the top 10 most actively used keys within the selected data bucket.
For Memcached bucket types, the Memcached statistic summary is provided.
Bucket Monitoring — Summary Statistics
The summary section is designed to provide a quick overview of the cluster activity. Each graph (or selected graph) shows information based on the currently selected bucket.
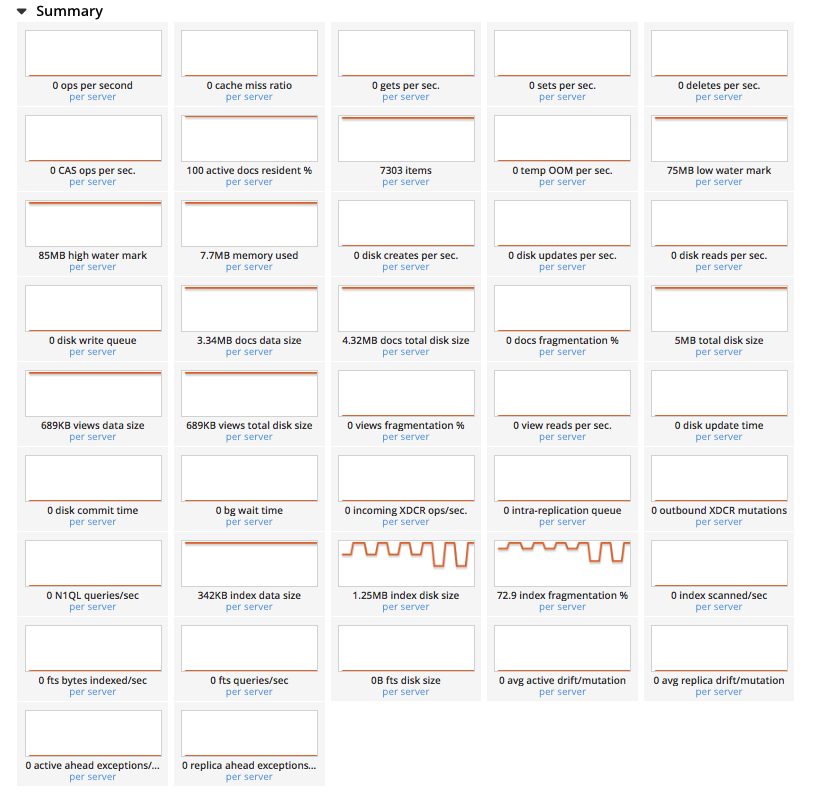
The following statistics are available:
| Statistic | Description |
|---|---|
ops per second |
The total number of operations per second on this bucket. |
cache miss ratio |
Ratio of reads per second to this bucket which required a read from disk rather than RAM. |
gets per sec. |
Number of get operations per second from this bucket. |
sets per sec. |
Number of set operations per second to this bucket. |
deletes per sec. |
Number of delete operations per second for this bucket. |
CAS ops per sec. |
Number of operations with a CAS identification per second for this bucket. |
active docs resident % |
The percentage of active items cached in RAM in this bucket. |
items |
Number of unique items (documents) stored in the bucket. |
temp OOM per sec. |
Number of temporary out of memory conditions per second. |
low water mark |
Low water mark for this bucket (based on the configured bucket RAM quota). |
high water mark |
High water mark for this bucket (based on the configured bucket RAM quota). |
memory used |
The memory used as measured from mem_used. |
disk creates per sec. |
Number of new items created on disk per second for this bucket. |
disk updates per sec. |
Number of items updated on disk per second for this bucket. |
disk reads per sec. |
Number of reads per second from disk for this bucket. |
disk write queue |
Number of items waiting to be written on disk in this bucket. |
docs data size |
Size of the stored document data. |
docs total disk size |
Size of the persisted stored document data on disk. |
doc fragmentation % |
Document fragmentation of persisted data as stored on disk. |
total disk size |
Total size of the information for this bucket as stored on disk, including persisted and view index data. |
view data size |
Size of the view data information. |
views total disk size |
Size of the view index information as stored on disk. |
views fragmentation % |
Percentage of fragmentation for a given view index. |
view reads per sec. |
Number of view reads per second. |
disk update time |
The time required to update data on disk. |
disk commit time |
The time required to commit data on disk. |
bg wait time |
The average background fetch time in microseconds. |
Incoming XDCR ops/sec. |
The incoming XDCR operations per second for this bucket. |
Intra-replication queue |
Number of items remaining to be sent to consumer in this bucket. |
N1QL queries/sec |
Number of N1QL requests processed per second. |
index data size |
The data size consumed by the index. |
index disk size |
The total disk sized consumed by the index. |
index fragmentation % |
The percentage fragmentation of the index. |
index scanned/sec |
Number of index items scanned by the indexer per second. |
fts bytes indexed/sec |
Number of full text search bytes indexed per second. |
fts queries/sec |
Number of full text search queries per second. |
fts disk size |
The total full text search disk size for this bucket. |
avg active drift/mutation |
Average drift (in seconds) per mutation on active vBuckets. |
avg replica drift/mutation |
Average drift (in seconds) per mutation on replica vBuckets. |
active ahead exceptions/sec |
Total number of ahead exceptions all active vBuckets. |
replica ahead exceptions/sec |
Total number of ahead exceptions all replica vBuckets. |
creates per second |
Number of new items created in this bucket per second. |
updates per second |
Number of existing items updated in this bucket per second. |
XDCR ops per sec |
Number of XDCR related operations per second for this bucket. |
disk reads per sec |
Number of reads per second from disk for this bucket. |
disk write queue |
Size of the disk write queue. |
XDC replication queue |
Size of the XDCR replication queue. |
memory used |
Amount of memory used for storing the information in this bucket. |
Monitoring Server Resources
The Server Resources statistics section displays the resource information on this server including swap usage, free RAM, CPU utilization percentage, connections, port requests, streaming requests, index RAM used, remaining index RAM, and FTS RAM used.
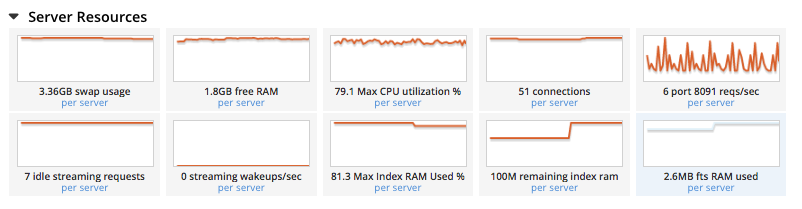
The displayed statistics are:
| Statistic | Description |
|---|---|
swap usage |
The amount of swap space in use on this server. |
free RAM |
The amount of RAM available on this server. |
Max CPU utilization % |
The percentage of CPU in use across all available cores on this server. |
connections |
The number connections on this server. |
port requests/sec |
The rate of HTTP requests on this port. |
streaming requests |
The number of streaming requests. |
streaming wakeups/sec |
The number of streaming request wakeups. |
Max index RAM used % |
The percentage of index RAM in use across all indexes on this server. |
remaining index RAM |
The amount of index RAM available on this server. |
FTS RAM used |
The amount of RAM used by FTS on this server. |
Monitoring vBucket Resources
The vBucket statistics provide information for all vBucket types within the cluster across three different states. Within the statistic display the table of statistics is organized in four columns, showing the Active, Replica and Pending states for each individual statistic. The last column provides the total value for each statistic.
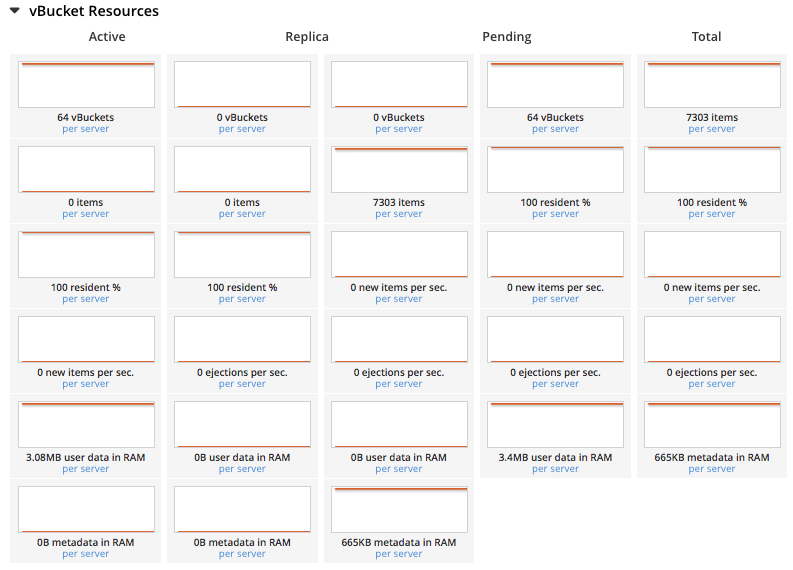
The Active column displays the information for vBuckets within the Active state. The Replica column displays the statistics for vBuckets within the Replica state (that is currently being replicated). The Pending columns shows statistics for vBuckets in the Pending state, that is while data is being exchanged during rebalancing.
These states are shared across all the following statistics. For example, the graph new items per sec within the Active state column displays the number of new items per second created within the vBuckets that are in the active state.
The individual statistics, one for each state, shown are:
| Statistic | Description | ||
|---|---|---|---|
vBuckets |
The number of vBuckets within the specified state. |
||
items |
Number of items within the vBucket of the specified state. |
||
resident % |
Percentage of items within the vBuckets of the specified state that are resident (in RAM). |
||
new items per sec. |
Number of new items created in vBuckets within the specified state.
|
||
ejections per sec. |
Number of items ejected per second within the vBuckets of the specified state. |
||
user data in RAM |
Size of user data within vBuckets of the specified state that are resident in RAM. |
||
metadata in RAM |
Size of item metadata within the vBuckets of the specified state that are resident in RAM. |
Monitoring Disk Queues
The Disk Queues statistics section displays the information for data being placed into the disk queue. Disk queues are used within Couchbase Server to store the information written to RAM on disk for persistence. Information is displayed for each of the disk queue states, Active, Replica, and Pending.
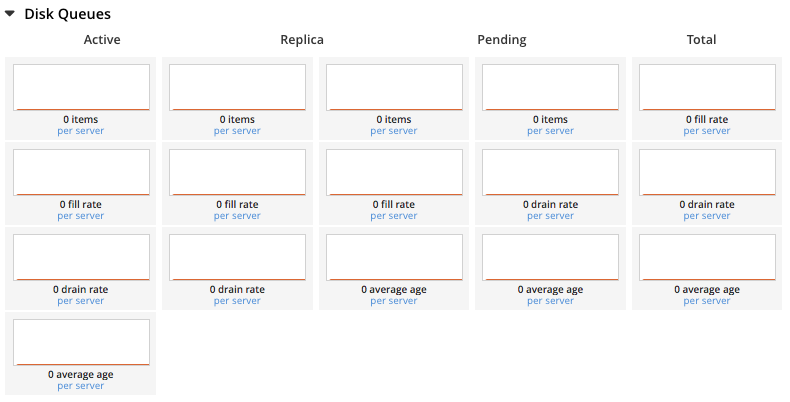
The Active column displays the information for the Disk Queues within the Active state. The Replica column displays the statistics for the Disk Queues within the Replica state (that is currently being replicated). The Pending columns shows statistics for the disk Queues in the Pending state, that is while data is being exchanged during rebalancing.
These states are shared across all the following statistics. For example, the graph fill rate within the Replica state column displays the number of items being put into the replica disk queue for the selected bucket.
The displayed statistics are:
| Statistic | Description |
|---|---|
items |
The number of items waiting to be written to disk for this bucket for this state. |
fill rate |
The number of items per second being added to the disk queue for the corresponding state. |
drain rate |
The number of items actually written to disk from the disk queue for the corresponding state. |
average age |
The average age of items (in seconds) within the disk queue for the specified state. |
Monitoring DCP Queues
The DCP queues statistics are designed to show information about the DCP connections activity for the bucket. The statistics information is therefore organized as a table with columns showing the statistics for DCP queues used for replication, XDCR, views/indexes, and other.
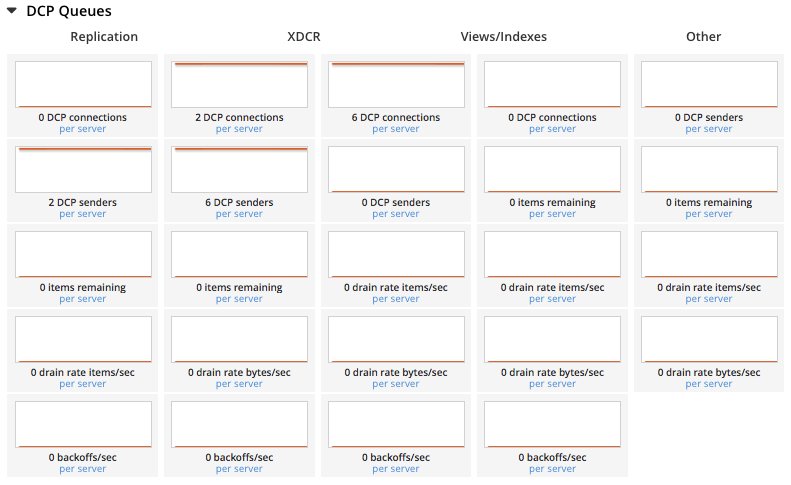
The statistics are detailed below:
| Statistic | Description |
|---|---|
DCP connections |
Number of internal replication DCP connections in this bucket. |
DCP senders |
Number of replication senders for this bucket. |
items remaining |
Number of items remaining to be sent to consumer in this bucket. |
drain rate items/sec |
Number of items per second being sent for a producer for this bucket. |
drain rate bytes/sec |
Number of bytes per second being sent for replication DCP connections for this bucket. |
backoffs/sec |
Number of backoffs for replication DCP connections. |
Monitoring View Statistics
The View Stats show information about individual design documents within the selected bucket. One block of stats will be shown for each production-level design document.
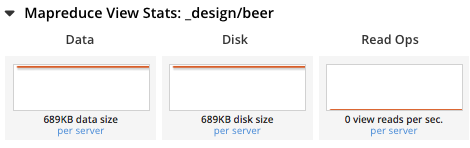
The statistics shown are:
| Statistics | Description |
|---|---|
data size |
Size of the data required for this design document. |
disk size |
Size of the stored index as stored on disk. |
view reads per sec. |
Number of read operations per second for this view. |
Monitoring Index Statistics
The INDEX STATS section provides statistics about the GSI Indexes. Statistics are provided per each individual index.
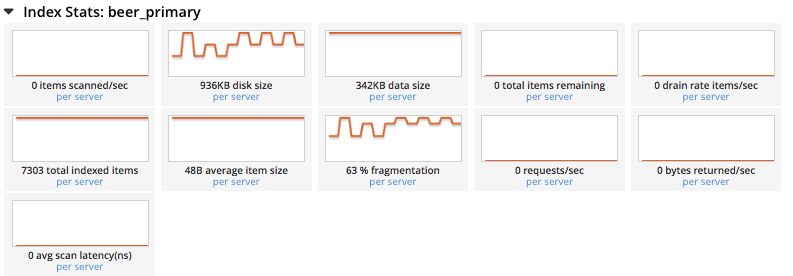
The statistics in this section are detailed below:
| Statistic | Description |
|---|---|
items scanned/sec |
Number of index items scanned by the indexer per second. |
disk size |
Total disk file size consumed by the index. |
data size |
Actual data size consumed by the index. |
total items remaining |
Number of documents pending to be indexed. |
drain rate items/sec |
Number of documents indexed by the indexer per second. |
total indexed items |
The total number of documents indexed. |
average item size |
The average size of each index item. |
% fragmentation |
Percentage fragmentation of the index. This indicates the % of disk space consumed by the index, but not utilized for items stored in the index. |
requests/sec |
Number of requests served by the indexer per second. |
bytes returned/sec |
Number of bytes per second read by a scan. |
avg scan latency(ns) |
The average time to serve a scan request in nanoseconds. |
Memcached Buckets
For Memcached buckets, Web Console displays a separate group of statistics:
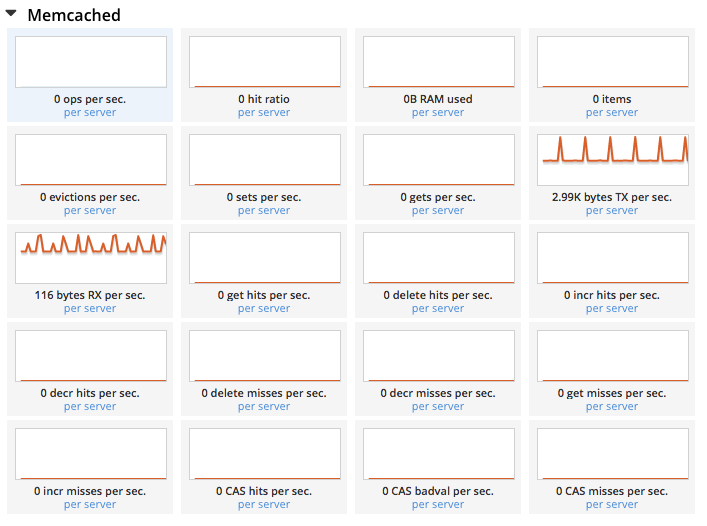
The Memcached statistics are:
| Statistic | Description |
|---|---|
ops per sec. |
Total operations per second serviced by this bucket. |
hit ratio |
Percentage of get requests served with data from this bucket. |
RAM used |
Total amount of RAM used by this bucket. |
items count |
Number of items stored in this bucket. |
evictions per sec. |
Number of items per second evicted from this bucket. |
sets per sec. |
Number of set operations serviced by this bucket. |
gets per sec. |
Number of get operations serviced by this bucket. |
bytes TX per sec |
Number of bytes per second sent from this bucket. |
bytes RX per sec. |
Number of bytes per second sent into this bucket. |
get hits per sec. |
Number of get operations per second for data that this bucket contains. |
delete hits per sec. |
Number of delete operations per second for data that this bucket contains |
incr hits per sec. |
Number of increment operations per second for data that this bucket contains. |
decr hits per sec. |
Number of decrement operations per second for data that this bucket contains. |
delete misses per sec. |
Number of delete operations per second for data that this bucket does not contain. |
decr misses per sec. |
Number of decrement operations per second for data that this bucket does not contain. |
get misses per sec. |
Number of get operations per second for data that this bucket does not contain. |
incr misses per sec. |
Number of increment operations per second for data that this bucket does not contain. |
CAS hits per sec. |
Number of CAS operations per second for data that this bucket contains. |
CAS badval per sec. |
Number of CAS operations per second using an incorrect CAS ID for data that this bucket contains. |
CAS misses per sec. |
Number of CAS operations per second for data that this bucket does not contain. |
Monitoring Query Statistics
The Query section provides statistics about the N1QL query service. These statistics are aggregated numbers at the query service level across the cluster, and are not per bucket or per node.
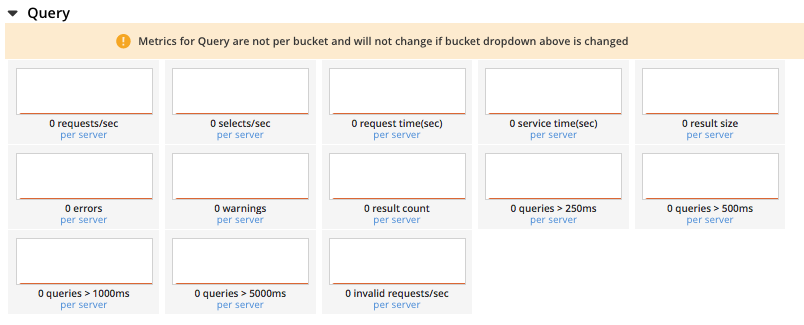
The statistics in this section are detailed below:
| Statistic | Description |
|---|---|
requests/sec |
Total number of N1QL requests processed per second. |
selects/sec |
Total number of SELECT requests processed per second. |
request time(sec) |
The average end-to-end time to process a query in seconds. |
service time(sec) |
The average time to execute a query in seconds. |
result size |
The average size in bytes of the data returned by the query. |
errors |
The total number of N1QL errors returned so far. |
warnings |
The total number of N1QL warnings returned so far. |
result count |
The average number of results (documents) returned by a query. |
queries > 250ms |
Number of queries that take longer than 250ms. |
queries > 5000ms |
Number of queries that take longer than 500ms. |
queries > 1000ms |
Number of queries that take longer than 1000ms. |
queries > 5000ms |
Number of queries that take longer than 5000ms. |
invalid requests/sec |
Number of requests for unsupported endpoints per second. |
Monitoring Outgoing XDCR
The Outgoing XDCR shows the XDCR operations that are supporting cross datacenter replication from the current cluster to a destination cluster.
You can monitor the current status for all active replications in the Ongoing Replications section on the XDCR page:
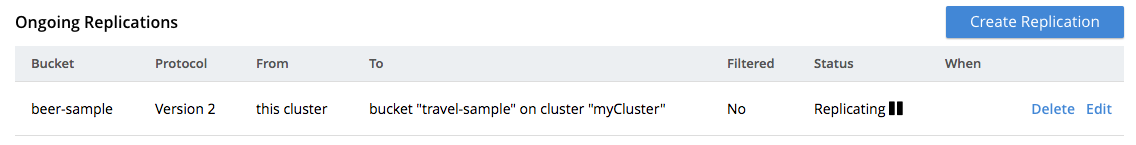
The Ongoing Replications pane shows the following information:
| Column | Description |
|---|---|
Bucket |
The source bucket on the current cluster that is being replicated. |
Protocol |
The protocol version. |
From |
The source cluster name. |
To |
The destination cluster name. |
Filtered |
Indicates if the filtering is set or not. |
Status |
The current status of replications. |
When |
Indicates when replication occurs. |
The Status column indicates the current state of the replication configuration. The options include:
-
Starting Up - The replication process has just started, and the clusters are determining what data needs to be sent from the originating cluster to the destination cluster.
-
Replicating - The bucket is currently being replicated and changes to the data stored on the originating cluster are being sent to the destination cluster.
-
Failed - Replication to the destination cluster has failed. The destination cluster cannot be reached. The replication configuration may need to be deleted and recreated.
From the Buckets menu, click the Statistics link for the Couchbase bucket to view more statistics for that bucket. Couchbase Web Console displays statistics for the particular bucket on this page. You can find two drop-down areas called in the Outgoing XDCR and Incoming XDCR Operations. Both provides statistics about ongoing replication for the particular bucket. Under the Outgoing XDCR panel, if you have multiple replication streams you will see statistics for each stream.
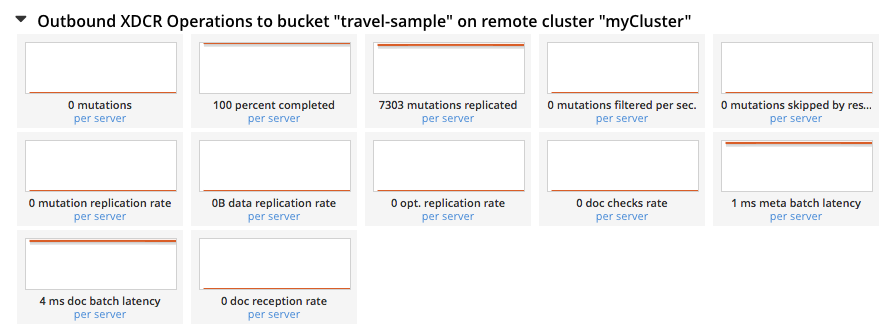
The statistics shown below may be different depending on the bucket data:
| Statistic | Description |
|---|---|
outbound mutations |
Number of changes in the queue waiting to be sent to the destination cluster. |
mutations checked |
Number of document mutations checked on source cluster. |
mutations replicated |
Number of document mutations replicated to the destination cluster. |
data replicated |
Size of data replicated in bytes. |
active vb reps |
Number of parallel, active vBucket replicators. Each vBucket has one replicator which can be active or waiting. By default you can only have 32 parallel active replicators at once per node. Once an active replicator finishes, it will pass a token to a waiting replicator. |
waiting vb reps |
Number of vBucket replicators that are waiting for a token to replicate. |
secs in replicating |
Total seconds elapsed for data replication for all vBuckets in a cluster. |
secs in checkpointing |
Time working in seconds including wait time for replication. |
checkpoints issued |
Total number of checkpoints issued in replication queue. By default active vBucket replicators issue a checkpoint every 30 minutes to keep track of replication progress. |
checkpoints failed |
Number of checkpoints failed during replication. This can happen due to timeouts, due to network issues or if a destination cluster cannot persist quickly enough. |
mutations in queue |
Number of document mutations waiting in replication queue. |
XDCR queue size |
Amount of memory used by mutations waiting in replication queue. In bytes. |
mutation replication rate |
Number of mutations replicated to destination cluster per second. |
data replication rate |
Bytes replicated to destination per second. |
ms meta ops latency |
Weighted average time for requesting document metadata in milliseconds. |
mutations replicated optimistically |
Total number of mutations replicated with optimistic XDCR. |
ms docs ops latency |
Weighted average time for sending mutations to destination cluster in milliseconds. |
percent completed |
Percent of total mutations checked for metadata. |
Be aware that if you use an earlier version of Couchbase Server, such as Couchbase Server 2.0, only the first three statistics appear and have the labels changes queue, documents checked, and documents replicated respectively. You can also get XDCR statistics using the Couchbase REST API. All of the statistics in Web Console are based on statistics via the REST API or values derived from them.
Monitoring Incoming XDCR
The Incoming XDCR Operations section shows the XDCR operations that are coming into to the current cluster from a remote cluster.
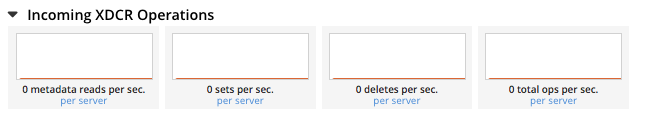
The statistics shown are:
| Statistic | Description |
|---|---|
metadata reads per sec. |
Number of documents XDCR scans for metadata per second. XDCR uses this information for conflict resolution. |
sets per sec. |
Set operations per second for incoming XDCR data. |
deletes per sec. |
Delete operations per second as a result of the incoming XDCR data stream. |
total ops per sec. |
Total of all the operations per second. |