Monitor a Replication
Statistical information on an XDCR replication can be gathered in real time.
Examples on This Page
The examples on this page show how to fully secure a replication; using the UI. Examples of monitoring XDCR with the REST API are provided in Getting XDCR Stats. No CLI command is available for general XDCR monitoring.
As their starting-point, the examples for the UI the scenario that concluded the page Resume a Replication.
Monitor an XDCR Replication with the UI
Information on current XDCR replications is provided by Couchbase Web Console per bucket. Therefore, to check status, access the Buckets screen (rather than the XDCR screen).
Access Statistics for the Source Bucket
Proceeds as follows:
-
Ascertain the name of the XDCR source bucket to be examined.
-
In the left-hand navigation panel for the source cluster, left-click on the Buckets tab:
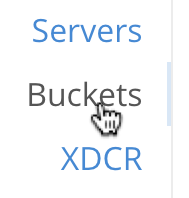
This displays the Buckets screen. A single bucket is displayed,
travel-samplewhich is the source for replication.
-
Left-click on the
Statisticstab, which is located at the right-hand side of the row for the bucket: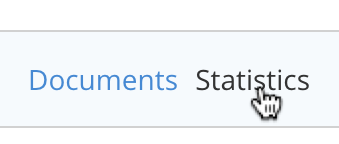
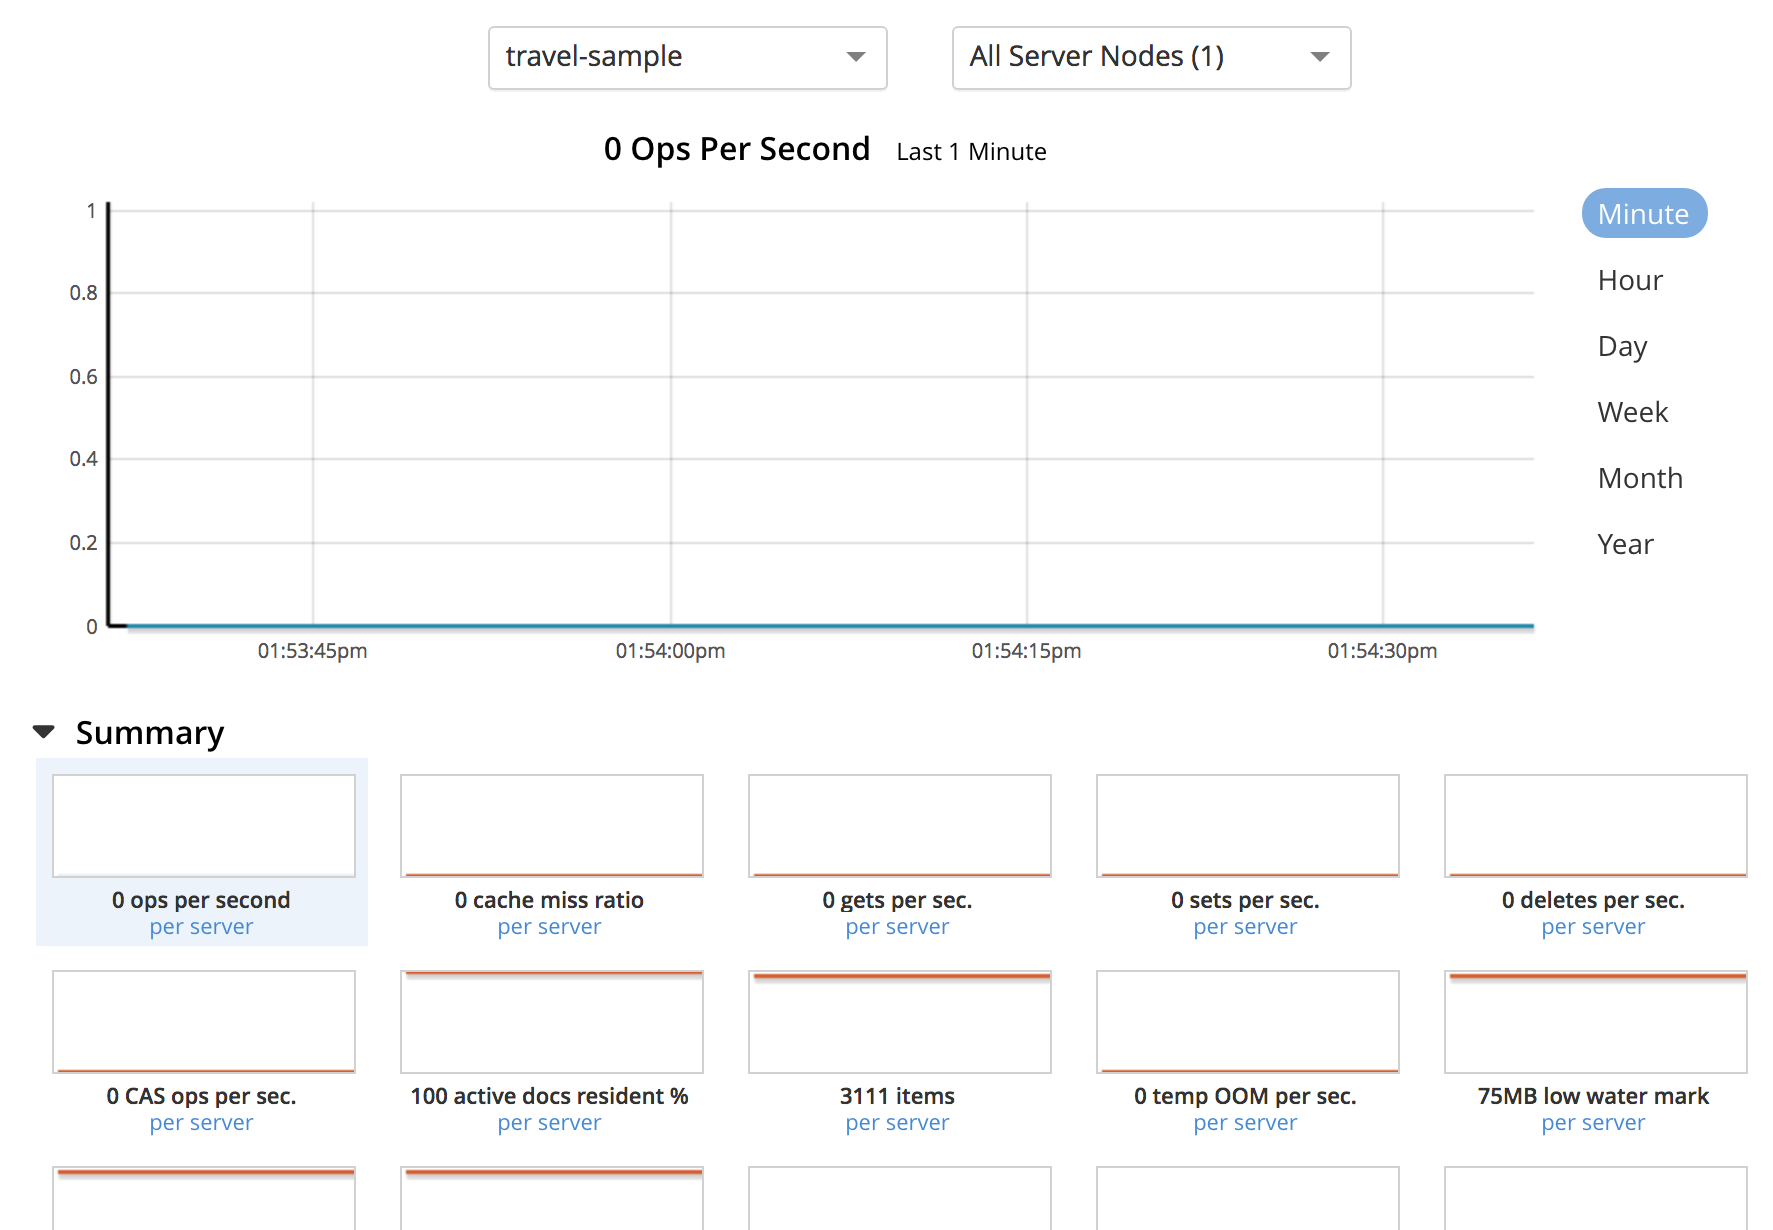
The Statistics screen is now displayed:
-
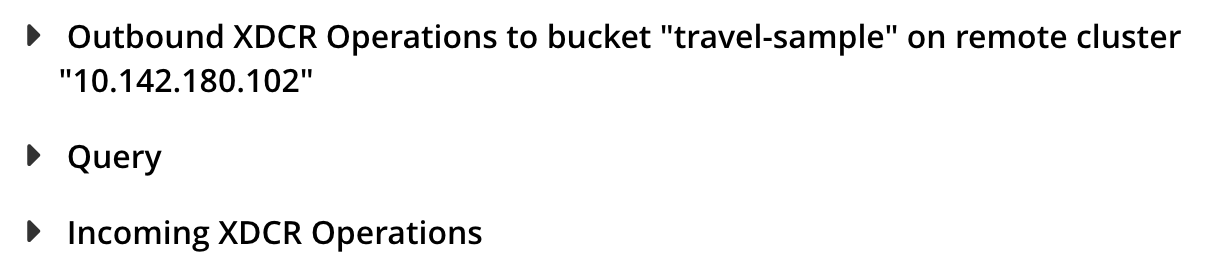
Scroll down the screen, until the XDCR statistics headers appear:
-
Left-click on the arrow for Outbound XDCR operations. The following graphical display is provided:
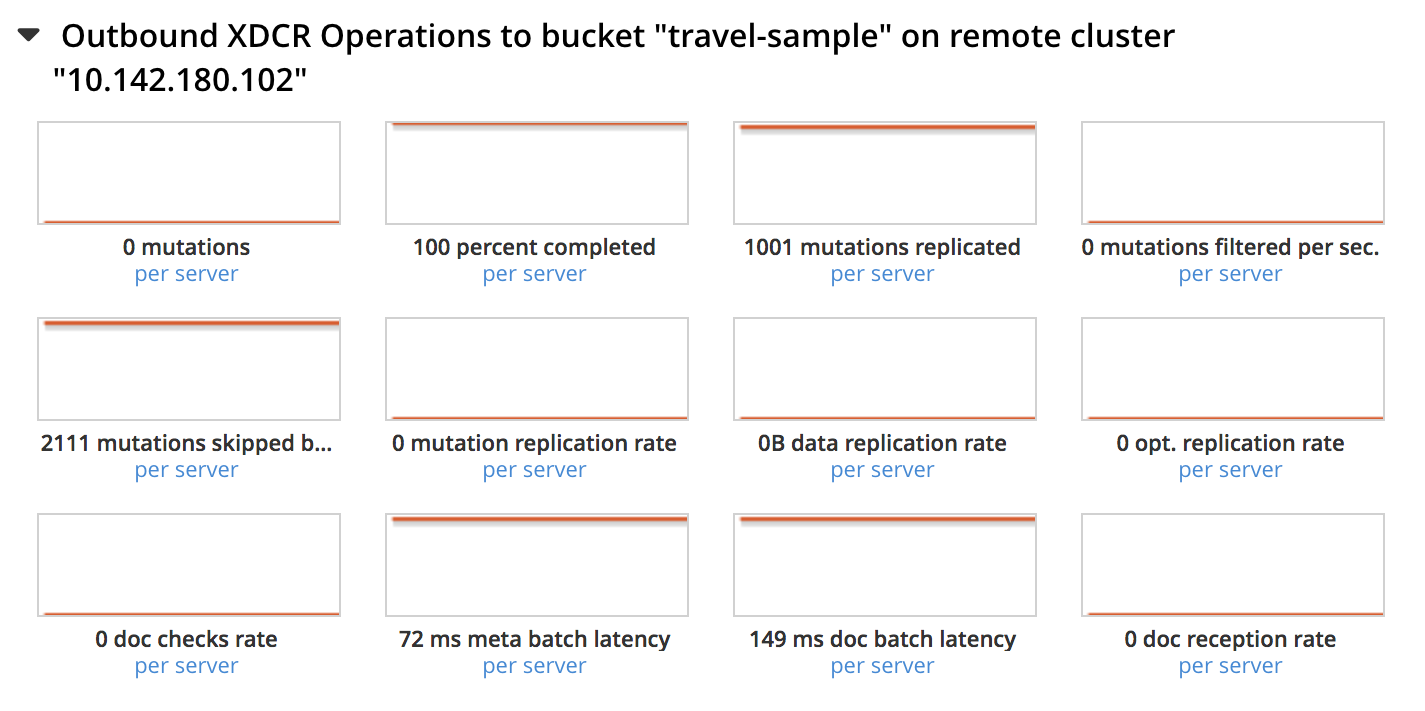
Each of the twelve graphs provides statistical information on the ongoing replication from the source bucket. Each graph is based on a particular Couchbase Server statistic. These are:
-
n mutations: The number of mutations to be replicated to other clusters (measured from the per-replication statistic
changes-left). -
n percent completed: The percentage of checked items out of all checked and to-be-replicated items (measured from the per-replication statistic
percent_completeness). -
n mutations replicated: The number of mutations that have been replicated to other clusters (measured from the per-replication statistic
docs_written). -
n mutations filtered per sec: The number of mutations per second that have been filtered out, and therefore not replicated to other clusters (measured from the per-replication statistic
docs_filtered). -
n mutations skipped by resolution: The number of mutations that failed conflict resolution on the source side, and therefore have not been replicated to other clusters (measured from the per-replication statistic
docs_failed_cr_source). -
n mutation replication rate: The rate of replication, in terms of the number of replicated mutations per second (measured from the per-replication statistic
rate_replicated). -
n B data replication rate: The rate of replication in terms of bytes replicated per second (measured from the per-replication statistic
bandwidth_usage). -
n opt. replication rate: The rate optimistic replications in terms of the number of replicated mutations per second.
-
n docs checks rate: The rate of document checks per second.
-
n ms meta batch latency: The weighted average latency is milliseconds of sending getMeta and waiting for a conflict solution result from the remote cluster (measured from the per-replication statistic
wtavg_meta_latency). -
n ms doc batch latency: The weighted average latency in milliseconds of sending replicated mutations to the remote cluster (measured from the per-replication statistic
wtavg_docs_latency). -
n doc reception rate: The rate of mutations received from DCP in terms of the number of mutations per second.
-
Access Statistics for the Target Bucket
Proceed as follows:
-
Ascertain the name of the XDCR target bucket to be examined.
-
In the left-hand navigation panel for the remote cluster, left-click on the Buckets tab, and access the statistics for the bucket according to the steps provided above, in Access Statistics for the Source Bucket.
-
Open the Incoming XDCR Operations panel. The following graphical display is provided:
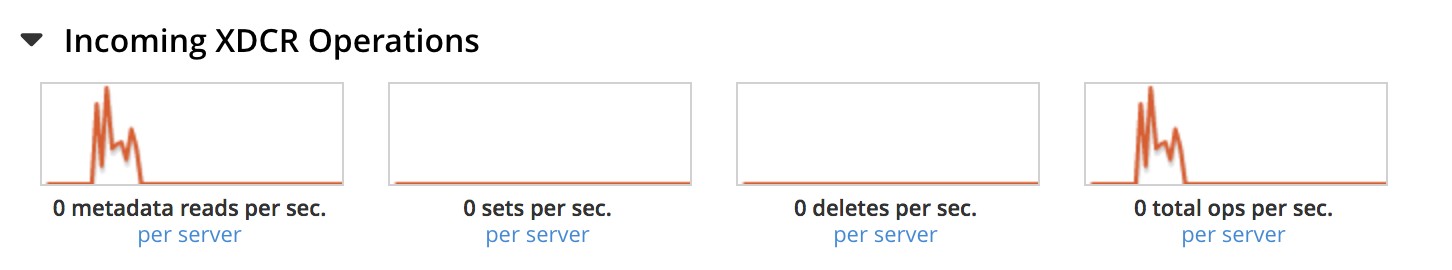
Each of the four graphs provides statistical information on an incoming replication from the source bucket:
-
n metadata reads per sec.: The number of metadata read operations per second for this bucket as the target for XDCR (measured from the statistic
ep_num_ops_get_meta). -
n sets per second: The number of set operations per second for this buckets as the target for XDCR (measured from the statistic
ep_num_ops_set_meta). -
n deletes per second: The number of delte operations per second for this bucket as the target for XDCR (measured from the statistic
ep_num_ops_del_meta). -
n total ops per sec: Total XDCR operations per second for this bucket (measured from the sum of the statistics
ep_num_ops_delmeta,ep_num_ops_get_meta, andep_num_ops_set_meta).
-
Monitoring Conflict Resolution
XDCR Conflict Resolution can be monitored by means of the cbstats CLI. See Monitoring XDCR Timestamp-based Conflict Resolution, for details.