Management Tools
Couchbase Server can be managed by means of Couchbase Web Console, the Command-Line Interface (CLI), and the REST API.
Couchbase Server Management Options
Couchbase Server can be managed by means of Couchbase Web Console, the Command-Line Interface (CLI), and the REST API.
The CLI and REST API both allow the IP address of a Couchbase Server-node to be specified, so that the target server is identified on the network. Both the CLI and REST API can be used in administrator-created scripts and programs, as well as on the command-line.
Couchbase Web Console is browser-based, and allows administrator-authentication at a login screen. Once granted access the Full Administrator can view all nodes in the Cluster, details of assigned services, memory quotas, statistics, and more. (Such information can also be returned by specific CLI and REST calls.)
Couchbase Server enforces Role-Based Access Control (RBAC), whereby all users are assigned roles that correspond to privileges on system-resources. Credentials must therefore be passed with each CLI or REST call.
Note that Couchbase Web Console and CLI are themselves based on the REST API.
By using the CLI with the -d (debug) option, the underlying REST method can be revealed in standard output.
Developer Tools provided by a browser such as Chrome likewise show ongoing REST calls while Couchbase Web Console is in use.
For a complete list of CLI commands, see the CLI Reference. For a complete list of REST API methods, see the REST API Reference. An introduction to Couchbase Web Console is provided immediately below.
For specific examples of managing nodes, buckets, and other Couchbase Server resources with all three tools, see the subsections that follow. Each page provides a key task (for example, Create a Cluster), and exemplifies this with each tool in turn.
Couchbase Web Console
Couchbase Web Console provides a graphical user interface, for the management of a Couchbase cluster.
For details on logging into the console, see Explore the Server Configuration. After successful login, an introductory Dashboard page is displayed.
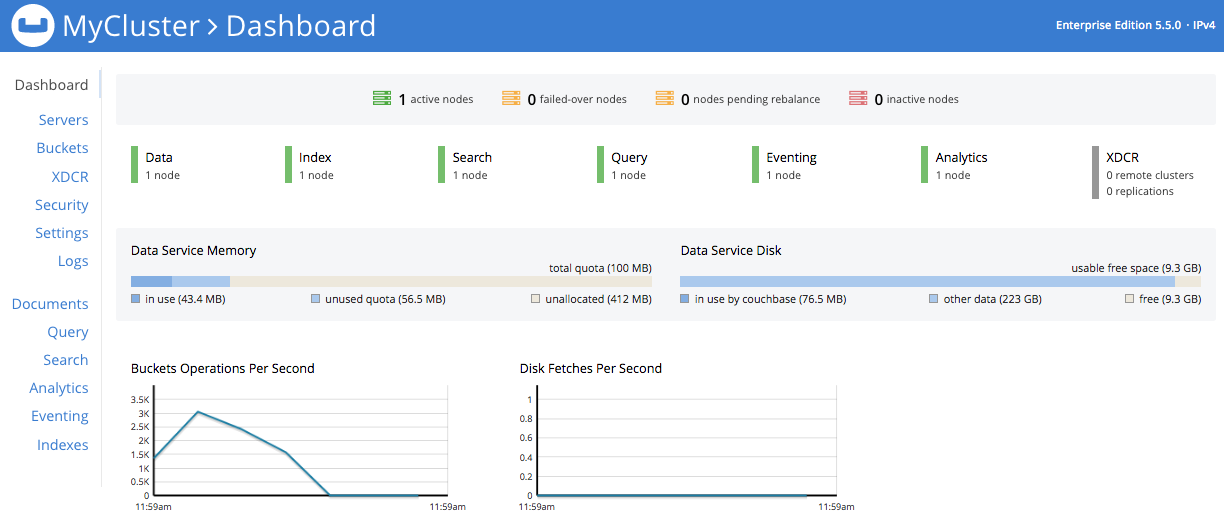
The Dashboard screen contains three sections: Services, Data Services, and Buckets.
Services
The Services section indicates all running services for the cluster.

| Field | Description |
|---|---|
Data Service |
The number of nodes that have Data Service running. |
Index Service |
The number of nodes that have the Index Service running. |
FTS Service |
The number of nodes that have the Search (Full Text Search) Service running. |
Query Service |
The number of nodes that have the Query Service running. |
Eventing Service |
The number of nodes that have the Eventing Service running. |
Analytics Service |
The number of nodes that have the Analytics Service running. |
XDCR |
The number of remote clusters and replications on this cluster. |
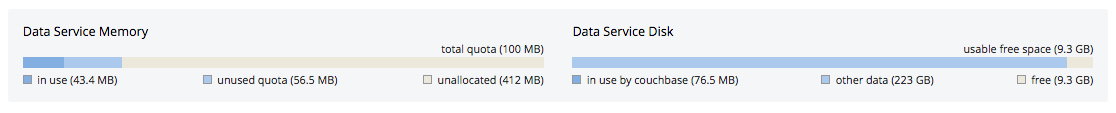
Data Services
The Data Services section provides information on the memory and disk usage information of your cluster.
| Field | Description |
|---|---|
Data Service Memory section provides a graphical representation of your RAM situation. |
|
total quota |
The amount of RAM allocated to buckets within your cluster. |
unallocated |
The amount of RAM not allocated to buckets within your cluster. |
unused |
The amount of memory that is unused (available) for storing data. |
in use |
The amount of memory across all buckets that is actually in use for the storing of data). |
Data Service Disk section provides similar information for disk storage-space across the cluster. |
|
usable free space |
The amount of usable space for storing information on disk. This figure shows the amount of space available on the configured path after non-Couchbase files have been taken into account. |
free |
The free space available for storing objects on disk. |
other data |
The quantity of disk space in use by data other than Couchbase data. For memory, this consists of the memory consumed by all other Couchbase Server-processes ( |
in use |
The amount of disk space being used to store information on disk. |
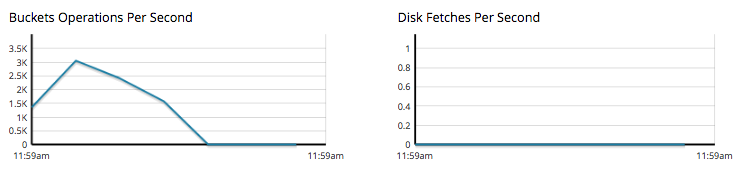
Buckets
The Buckets section provides the following two graphs:
| Graph Name | Description |
|---|---|
Operations Per Second |
Provides information on the level of cluster-activity in terms of storing and retrieving objects from the data store. |
Disk Fetches Per Second |
Indicates how frequently Couchbase Server is retrieving information from disk. |